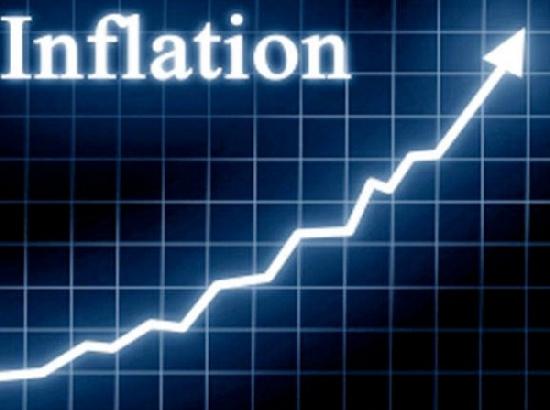
Retail Inflation Eases to 4.83% in April, 2024
The Fact News Service
New Delhi, May 13
The annual inflation rate based on all India Consumer Price Index (CPI) number is 4.83% (Provisional) for the month of April, 2024 (over April, 2023). Corresponding inflation rate for rural and urban is 5.43% and 4.11%, respectively.
-
- CPI for the months of January, February and March 2024 are 5.10, 5.09 and 4.85 respectively.
- Among the top five groups, the year-on-year inflation on groups ‘Clothing & Footwear’, ‘Housing’ and ‘Fuel & light’ has decreased since last month.
- All India Inflation rates (on point to point basis i.e. current month over same month of last year, i.e.
April 2024 over April 2023), based on General Indices and CFPIs are given as follows:
All India year-on-year inflation rates (%) based on CPI (General) and CFPI: April 2024 over April
2023
| Apr. 2024 (Prov.) | Mar. 2024 (Final) | Apr. 2023 | ||||||||
| Rural | Urban | Combd. | Rural | Urban | Combd. | Rural | Urban | Combd. | ||
| Inflation | CPI (General) | 5.43 | 4.11 | 4.83 | 5.51 | 4.14 | 4.85 | 4.68 | 4.85 | 4.70 |
| CFPI | 8.75 | 8.56 | 8.70 | 8.55 | 8.41 | 8.52 | 3.89 | 3.69 | 3.84 | |
| Index | CPI (General) | 188.5 | 184.7 | 186.7 | 187.8 | 183.6 | 185.8 | 178.8 | 177.4 | 178.1 |
| CFPI | 188.9 | 195.4 | 191.2 | 187.8 | 193.4 | 189.8 | 173.7 | 180.0 | 175.9 | |
Notes: Prov. – Provisional, Combd. – Combined
- Monthly changes in the General Indices and CFPIs are given below:
Monthly changes (%) in All India CPI (General) and CFPI: April 2024 over March 2024
| Indices | Apr. 2024 (Prov.) | Mar. 2024 (Final) | Monthly change (%) | ||||||
| Rural | Urban | Combd. | Rural | Urban | Combd. | Rural | Urban | Combd. | |
| CPI (General) | 188.5 | 184.7 | 186.7 | 187.8 | 183.6 | 185.8 | 0.37 | 0.60 | 0.48 |
| CFPI | 188.9 | 195.4 | 191.2 | 187.8 | 193.4 | 189.8 | 0.59 | 1.03 | 0.74 |
Note: Figures of April 2024 are provisional.
- Response rate: The price data are collected from selected 1114 urban Markets and 1181 villages covering all States/UTs through personal visits by field staff of Field Operations Division of NSO, MoSPI on a weekly roster. During the month of April 2024, NSO collected prices from 99.9% villages and 98.5% urban markets while the market-wise prices reported therein were 89.8% for rural and 93.2% for urban.
- Next date of release for May 2024 CPI is 12th June 2024 (Wednesday). For more details please visit the website www.mospi.gov.in
List of Annex
| Annex | Title |
| I | All-India General, Group and Sub-group level CPI and CFPI numbers for March 2024 (Final) and April 2024 (Provisional) for Rural, Urban and Combined |
| II | All-India inflation rates (%) for General, Group and Sub-group level CPI and CFPI numbers for April 2024 (Provisional) for Rural, Urban and Combined |
| III | General CPI for States for Rural, Urban and Combined for March 2024 (Final) and April 2024 (Provisional) |
| IV | Year-on-year inflation rates (%) of major States for Rural, Urban and Combined for April 2024 (Provisional) |
Annex I
All-India General, Group and Sub-group level CPI and CFPI numbers for March 2024 (Final) and April 2024 (Provisional) for Rural, Urban and Combined
(Base: 2012=100)
| Group Code | Sub-group Code | Description | Rural | Urban | Combined | ||||||
| Weights | Mar. 24 Index (Final) |
Apr. 24 Index (Prov.) |
Weights | Mar. 24 Index (Final) |
Apr. 24 Index (Prov.) |
Weights | Mar. 24 Index (Final) |
Apr. 24 Index (Prov.) |
|||
| (1) | (2) | (3) | (4) | (5) | (6) | (7) | (8) | (9) | (10) | (11) | (12) |
| 1.1.01 | Cereals and products | 12.35 | 189.3 | 188.8 | 6.59 | 188.5 | 188.9 | 9.67 | 189.0 | 188.8 | |
| 1.1.02 | Meat and fish | 4.38 | 217.9 | 223.0 | 2.73 | 226.7 | 232.8 | 3.61 | 221.0 | 226.4 | |
| 1.1.03 | Egg | 0.49 | 192.7 | 180.1 | 0.36 | 194.3 | 184.1 | 0.43 | 193.3 | 181.6 | |
| 1.1.04 | Milk and products | 7.72 | 183.2 | 183.6 | 5.33 | 183.6 | 184.0 | 6.61 | 183.3 | 183.7 | |
| 1.1.05 | Oils and fats | 4.21 | 160.2 | 160.4 | 2.81 | 154.7 | 154.9 | 3.56 | 158.2 | 158.4 | |
| 1.1.06 | Fruits | 2.88 | 172.8 | 182.7 | 2.90 | 176.7 | 188.6 | 2.89 | 174.6 | 185.5 | |
| 1.1.07 | Vegetables | 7.46 | 182.5 | 184.9 | 4.41 | 222.6 | 225.3 | 6.04 | 196.1 | 198.6 | |
| 1.1.08 | Pulses and products | 2.95 | 199.7 | 200.7 | 1.73 | 205.0 | 206.2 | 2.38 | 201.5 | 202.6 | |
| 1.1.09 | Sugar and Confectionery | 1.70 | 128.0 | 127.7 | 0.97 | 130.1 | 130.2 | 1.36 | 128.7 | 128.5 | |
| 1.1.10 | Spices | 3.11 | 236.3 | 231.8 | 1.79 | 228.2 | 224.7 | 2.50 | 233.6 | 229.4 | |
| 1.2.11 | Non-alcoholic beverages | 1.37 | 182.1 | 182.2 | 1.13 | 170.3 | 170.6 | 1.26 | 177.2 | 177.4 | |
| 1.1.12 | Prepared meals, snacks, sweets etc. | 5.56 | 195.9 | 196.2 | 5.54 | 204.6 | 204.9 | 5.55 | 199.9 | 200.2 | |
| 1 | Food and beverages | 54.18 | 188.5 | 189.5 | 36.29 | 194.4 | 196.1 | 45.86 | 190.7 | 191.9 | |
| 2 | Pan, tobacco and intoxicants | 3.26 | 204.0 | 204.9 | 1.36 | 210.2 | 211.1 | 2.38 | 205.7 | 206.6 | |
| 3.1.01 | Clothing | 6.32 | 195.8 | 196.2 | 4.72 | 185.8 | 186.2 | 5.58 | 191.9 | 192.3 | |
| 3.1.02 | Footwear | 1.04 | 191.1 | 191.1 | 0.85 | 172.3 | 172.8 | 0.95 | 183.3 | 183.5 | |
| 3 | Clothing and footwear | 7.36 | 195.1 | 195.5 | 5.57 | 183.8 | 184.2 | 6.53 | 190.6 | 191.0 | |
| 4 | Housing | – | – | – | 21.67 | 178.2 | 179.9 | 10.07 | 178.2 | 179.9 | |
| 5 | Fuel and light | 7.94 | 181.0 | 179.2 | 5.58 | 167.4 | 165.5 | 6.84 | 175.8 | 174.0 | |
| 6.1.01 | Household goods and services | 3.75 | 183.3 | 183.7 | 3.87 | 174.0 | 174.4 | 3.80 | 178.9 | 179.3 | |
| 6.1.02 | Health | 6.83 | 194.3 | 194.9 | 4.81 | 189.1 | 189.7 | 5.89 | 192.3 | 192.9 | |
| 6.1.03 | Transport and communication | 7.60 | 172.0 | 171.8 | 9.73 | 161.9 | 161.4 | 8.59 | 166.7 | 166.3 | |
| 6.1.04 | Recreation and amusement | 1.37 | 177.8 | 178.1 | 2.04 | 172.8 | 173.0 | 1.68 | 175.0 | 175.2 | |
| 6.1.05 | Education | 3.46 | 186.1 | 186.7 | 5.62 | 181.2 | 181.8 | 4.46 | 183.2 | 183.8 | |
| 6.1.06 | Personal care and effects | 4.25 | 191.3 | 196.9 | 3.47 | 192.8 | 198.8 | 3.89 | 191.9 | 197.7 | |
| 6 | Miscellaneous | 27.26 | 184.2 | 185.4 | 29.53 | 176.0 | 176.8 | 28.32 | 180.2 | 181.2 | |
| General Index (All Groups) | 100.00 | 187.8 | 188.5 | 100.00 | 183.6 | 184.7 | 100.00 | 185.8 | 186.7 | ||
| Consumer Food Price Index (CFPI) | 47.25 | 187.8 | 188.9 | 29.62 | 193.4 | 195.4 | 39.06 | 189.8 | 191.2 | ||
Notes:
- Prov. : Provisional.
- CFPI : Out of 12 sub-groups contained in ‘Food and Beverages’ group, CFPI is based on ten sub-groups, excluding ‘Non-alcoholic beverages’ and ‘Prepared meals, snacks, sweets etc.’.
- – : CPI (Rural) for housing is not compiled.
Annex II
All-India year-on-year inflation rates (%) for General, Group and Sub-group level CPI and CFPI numbers for April 2024 (Provisional) for Rural, Urban and Combined
(Base: 2012=100)
| Group Code | Sub-group Code | Description | Rural | Urban | Combined | ||||||||||||||
| Apr. 23 Index (Final) |
Apr. 24
Index |
Inflation Rate (%) |
Apr. 23 Index (Final) |
Apr. 24
Index |
Inflation Rate (%) |
Apr. 23 Index (Final) |
Apr. 24
Index |
Inflation Rate (%) |
|||||||||||
| (1) | (2) | (3) | (4) | (5) | (6) | (7) | (8) | (9) | (10) | (11) | (12) | ||||||||
| 1.1.01 | Cereals and products | 173.3 | 188.8 | 8.94 | 174.8 | 188.9 | 8.07 | 173.8 | 188.8 | 8.63 | |||||||||
| 1.1.02 | Meat and fish | 206.9 | 223.0 | 7.78 | 213.7 | 232.8 | 8.94 | 209.3 | 226.4 | 8.17 | |||||||||
| 1.1.03 | Egg | 167.9 | 180.1 | 7.27 | 172.4 | 184.1 | 6.79 | 169.6 | 181.6 | 7.08 | |||||||||
| 1.1.04 | Milk and products | 178.2 | 183.6 | 3.03 | 178.8 | 184.0 | 2.91 | 178.4 | 183.7 | 2.97 | |||||||||
| 1.1.05 | Oils and fats | 178.5 | 160.4 | -10.14 | 168.7 | 154.9 | -8.18 | 174.9 | 158.4 | -9.43 | |||||||||
| 1.1.06 | Fruits | 173.7 | 182.7 | 5.18 | 179.2 | 188.6 | 5.25 | 176.3 | 185.5 | 5.22 | |||||||||
| 1.1.07 | Vegetables | 142.8 | 184.9 | 29.48 | 179.9 | 225.3 | 25.24 | 155.4 | 198.6 | 27.80 | |||||||||
| 1.1.08 | Pulses and products | 172.8 | 200.7 | 16.15 | 174.7 | 206.2 | 18.03 | 173.4 | 202.6 | 16.84 | |||||||||
| 1.1.09 | Sugar and Confectionery | 120.4 | 127.7 | 6.06 | 123.1 | 130.2 | 5.77 | 121.3 | 128.5 | 5.94 | |||||||||
| 1.1.10 | Spices | 215.5 | 231.8 | 7.56 | 207.8 | 224.7 | 8.13 | 212.9 | 229.4 | 7.75 | |||||||||
| 1.2.11 | Non-alcoholic beverages | 178.2 | 182.2 | 2.24 | 165.5 | 170.6 | 3.08 | 172.9 | 177.4 | 2.60 | |||||||||
| 1.1.12 | Prepared meals, snacks, sweets etc. | 190.5 | 196.2 | 2.99 | 197.0 | 204.9 | 4.01 | 193.5 | 200.2 | 3.46 | |||||||||
| 1 | Food and beverages | 175.5 | 189.5 | 7.98 | 182.1 | 196.1 | 7.69 | 177.9 | 191.9 | 7.87 | |||||||||
| 2 | Pan, tobacco and intoxicants | 199.5 | 204.9 | 2.71 | 203.5 | 211.1 | 3.73 | 200.6 | 206.6 | 2.99 | |||||||||
| 3.1.01 | Clothing | 190.7 | 196.2 | 2.88 | 181.0 | 186.2 | 2.87 | 186.9 | 192.3 | 2.89 | |||||||||
| 3.1.02 | Footwear | 187.3 | 191.1 | 2.03 | 167.7 | 172.8 | 3.04 | 179.2 | 183.5 | 2.40 | |||||||||
| 3 | Clothing and footwear | 190.2 | 195.5 | 2.79 | 178.9 | 184.2 | 2.96 | 185.7 | 191.0 | 2.85 | |||||||||
| 4 | Housing | – | – | – | 175.2 | 179.9 | 2.68 | 175.2 | 179.9 | 2.68 | |||||||||
| 5 | Fuel and light | 181.5 | 179.2 | -1.27 | 182.1 | 165.5 | -9.12 | 181.7 | 174.0 | -4.24 | |||||||||
| 6.1.01 | Household goods and services | 179.1 | 183.7 | 2.57 | 169.6 | 174.4 | 2.83 | 174.6 | 179.3 | 2.69 | |||||||||
| 6.1.02 | Health | 187.2 | 194.9 | 4.11 | 181.5 | 189.7 | 4.52 | 185.0 | 192.9 | 4.27 | |||||||||
| 6.1.03 | Transport and communication | 169.4 | 171.8 | 1.42 | 160.1 | 161.4 | 0.81 | 164.5 | 166.3 | 1.09 | |||||||||
| 6.1.04 | Recreation and amusement | 173.2 | 178.1 | 2.83 | 168.8 | 173.0 | 2.49 | 170.7 | 175.2 | 2.64 | |||||||||
| 6.1.05 | Education | 179.4 | 186.7 | 4.07 | 174.2 | 181.8 | 4.36 | 176.4 | 183.8 | 4.20 | |||||||||
| 6.1.06 | Personal care and effects | 183.8 | 196.9 | 7.13 | 184.4 | 198.8 | 7.81 | 184.0 | 197.7 | 7.45 | |||||||||
| 6 | Miscellaneous | 178.9 | 185.4 | 3.63 | 170.9 | 176.8 | 3.45 | 175.0 | 181.2 | 3.54 | |||||||||
| General Index (All Groups) | 178.8 | 188.5 | 5.43 | 177.4 | 184.7 | 4.11 | 178.1 | 186.7 | 4.83 | ||||||||||
| Consumer Food Price Index | 173.7 | 188.9 | 8.75 | 180.0 | 195.4 | 8.56 | 175.9 | 191.2 | 8.70 | ||||||||||
Notes:
- Prov. : Provisional.
- – : CPI (Rural) for housing is not compiled.
Annex III
General CPI for States for Rural, Urban and Combined for March 2024 (Final) and April 2024 (Provisional)
(Base: 2012=100)
| Sl. No. | Name of the State/UT | Rural | Urban | Combined | ||||||
| Weights | Mar. 24 Index (Final) |
Apr. 24 Index (Prov.) |
Weights | Mar. 24 Index (Final) |
Apr. 24 Index (Prov.) |
Weights | Mar. 24 Index (Final) |
Apr. 24 Index (Prov.) |
||
| (1) | (2) | (3) | (4) | (5) | (6) | (7) | (8) | (9) | (10) | (11) |
| 1 | Andhra Pradesh | 5.40 | 191.6 | 192.8 | 3.64 | 191.9 | 192.9 | 4.58 | 191.7 | 192.8 |
| 2 | Arunachal Pradesh | 0.14 | 190.4 | 191.6 | 0.06 | — | — | 0.10 | 190.4 | 191.6 |
| 3 | Assam | 2.63 | 189.4 | 190.0 | 0.79 | 184.8 | 185.9 | 1.77 | 188.5 | 189.2 |
| 4 | Bihar | 8.21 | 182.2 | 181.8 | 1.62 | 188.7 | 189.8 | 5.14 | 183.1 | 183.0 |
| 5 | Chhattisgarh | 1.68 | 177.4 | 179.0 | 1.22 | 174.5 | 176.2 | 1.46 | 176.3 | 177.9 |
| 6 | Delhi | 0.28 | 169.6 | 169.7 | 5.64 | 169.4 | 169.2 | 2.77 | 169.4 | 169.2 |
| 7 | Goa | 0.14 | 172.8 | 171.4 | 0.25 | 174.9 | 176.0 | 0.19 | 174.1 | 174.2 |
| 8 | Gujarat | 4.54 | 183.9 | 184.6 | 6.82 | 174.3 | 175.1 | 5.60 | 178.5 | 179.2 |
| 9 | Haryana | 3.30 | 188.9 | 190.4 | 3.35 | 177.8 | 178.8 | 3.32 | 183.7 | 185.0 |
| 10 | Himachal Pradesh | 1.03 | 173.9 | 175.5 | 0.26 | 178.7 | 180.4 | 0.67 | 174.8 | 176.4 |
| 11 | Jharkhand | 1.96 | 182.5 | 182.3 | 1.39 | 184.0 | 185.2 | 1.69 | 183.1 | 183.4 |
| 12 | Karnataka | 5.09 | 190.5 | 191.1 | 6.81 | 191.9 | 193.5 | 5.89 | 191.3 | 192.4 |
| 13 | Kerala | 5.50 | 193.4 | 196.5 | 3.46 | 191.1 | 193.6 | 4.55 | 192.6 | 195.5 |
| 14 | Madhya Pradesh | 4.93 | 184.7 | 185.2 | 3.97 | 187.4 | 188.0 | 4.48 | 185.8 | 186.4 |
| 15 | Maharashtra | 8.25 | 186.3 | 186.7 | 18.86 | 179.0 | 180.4 | 13.18 | 181.4 | 182.5 |
| 16 | Manipur | 0.23 | 218.6 | 218.6 | 0.12 | 182.3 | 183.8 | 0.18 | 207.1 | 207.6 |
| 17 | Meghalaya | 0.28 | 172.3 | 171.6 | 0.15 | 177.2 | 177.4 | 0.22 | 173.8 | 173.4 |
| 18 | Mizoram | 0.07 | 203.6 | 204.0 | 0.13 | 173.1 | 174.4 | 0.10 | 185.0 | 185.9 |
| 19 | Nagaland | 0.14 | 193.9 | 195.4 | 0.12 | 178.6 | 178.9 | 0.13 | 187.4 | 188.4 |
| 20 | Odisha | 2.93 | 188.8 | 190.5 | 1.31 | 181.3 | 182.6 | 2.18 | 186.7 | 188.3 |
| 21 | Punjab | 3.31 | 181.4 | 182.0 | 3.09 | 173.8 | 173.7 | 3.21 | 178.0 | 178.3 |
| 22 | Rajasthan | 6.63 | 184.9 | 185.3 | 4.23 | 183.6 | 184.0 | 5.51 | 184.4 | 184.8 |
| 23 | Sikkim | 0.06 | 196.3 | 196.1 | 0.03 | 184.7 | 185.5 | 0.05 | 192.5 | 192.6 |
| 24 | Tamil Nadu | 5.55 | 193.3 | 194.7 | 9.20 | 190.9 | 192.8 | 7.25 | 191.9 | 193.6 |
| 25 | Telangana | 3.16 | 201.8 | 203.2 | 4.41 | 195.0 | 195.7 | 3.74 | 198.1 | 199.1 |
| 26 | Tripura | 0.35 | 203.7 | 207.2 | 0.14 | 193.1 | 195.5 | 0.25 | 201.0 | 204.2 |
| 27 | Uttar Pradesh | 14.83 | 187.2 | 187.5 | 9.54 | 184.8 | 185.8 | 12.37 | 186.3 | 186.9 |
| 28 | Uttarakhand | 1.06 | 181.9 | 182.5 | 0.73 | 183.6 | 185.1 | 0.91 | 182.5 | 183.5 |
| 29 | West Bengal | 6.99 | 190.5 | 190.6 | 7.20 | 187.3 | 188.6 | 7.09 | 189.0 | 189.7 |
| 30 | Andaman & Nicobar Islands | 0.05 | 193.3 | 193.7 | 0.07 | 181.9 | 183.3 | 0.06 | 187.5 | 188.4 |
| 31 | Chandigarh | 0.02 | 182.5 | 183.1 | 0.34 | 172.0 | 173.7 | 0.17 | 172.6 | 174.2 |
| 32 | Dadra & Nagar Haveli | 0.02 | 173.7 | 173.8 | 0.04 | 180.7 | 181.0 | 0.03 | 178.4 | 178.6 |
| 33 | Daman & Diu | 0.02 | 187.2 | 186.7 | 0.02 | 181.5 | 186.7 | 0.02 | 184.8 | 186.7 |
| 34 | Jammu & Kashmir* | 1.14 | 196.8 | 197.0 | 0.72 | 191.4 | 192.7 | 0.94 | 194.9 | 195.5 |
| 35 | Lakshadweep | 0.01 | 191.0 | 193.9 | 0.01 | 173.4 | 177.2 | 0.01 | 182.0 | 185.4 |
| 36 | Puducherry | 0.08 | 195.3 | 195.3 | 0.27 | 190.1 | 190.7 | 0.17 | 191.4 | 191.9 |
| All India | 100.00 | 187.8 | 188.5 | 100.00 | 183.6 | 184.7 | 100.00 | 185.8 | 186.7 | |
Notes:
- Prov.: Provisional
- –: indicates the receipt of price schedules is less than 80% of allocated schedules and therefore indices are not compiled.
- *: Figures of this row pertain to the prices and weights of the combined Union Territories of Jammu & Kashmir
and Ladakh (erstwhile State of Jammu & Kashmir).
Annex IV
Year-on-year inflation rates (%) of major@ States for Rural, Urban and Combined for April 2024 (Provisional)
(Base: 2012=100)
| Sl. No. | Name of the State/UT | Rural | Urban | Combined | ||||||
| Apr. 23 Index (Final) |
Apr. 24
Index |
Inflation Rate (%) |
Apr. 23 Index (Final) |
Apr. 24
Index |
Inflation Rate (%) |
Apr. 23 Index (Final) |
Apr. 24
Index |
Inflation Rate (%) |
||
| (1) | (2) | (3) | (4) | (5) | (6) | (7) | (8) | (9) | (10) | (11) |
| 1 | Andhra Pradesh | 181.5 | 192.8 | 6.23 | 184.4 | 192.9 | 4.61 | 182.6 | 192.8 | 5.59 |
| 2 | Assam | 179.5 | 190.0 | 5.85 | 177.2 | 185.9 | 4.91 | 179.0 | 189.2 | 5.70 |
| 3 | Bihar | 172.7 | 181.8 | 5.27 | 180.1 | 189.8 | 5.39 | 173.8 | 183.0 | 5.29 |
| 4 | Chhattisgarh | 168.7 | 179.0 | 6.11 | 167.6 | 176.2 | 5.13 | 168.3 | 177.9 | 5.70 |
| 5 | Delhi | 166.1 | 169.7 | 2.17 | 165.6 | 169.2 | 2.17 | 165.6 | 169.2 | 2.17 |
| 6 | Gujarat | 176.5 | 184.6 | 4.59 | 167.9 | 175.1 | 4.29 | 171.6 | 179.2 | 4.43 |
| 7 | Haryana | 178.5 | 190.4 | 6.67 | 171.2 | 178.8 | 4.44 | 175.1 | 185.0 | 5.65 |
| 8 | Himachal Pradesh | 167.9 | 175.5 | 4.53 | 175.3 | 180.4 | 2.91 | 169.2 | 176.4 | 4.26 |
| 9 | Jharkhand | 174.5 | 182.3 | 4.47 | 179.6 | 185.2 | 3.12 | 176.4 | 183.4 | 3.97 |
| 10 | Karnataka | 178.9 | 191.1 | 6.82 | 185.5 | 193.5 | 4.31 | 182.4 | 192.4 | 5.48 |
| 11 | Kerala | 186.4 | 196.5 | 5.42 | 184.2 | 193.6 | 5.10 | 185.6 | 195.5 | 5.33 |
| 12 | Madhya Pradesh | 174.8 | 185.2 | 5.95 | 180.2 | 188.0 | 4.33 | 177.0 | 186.4 | 5.31 |
| 13 | Maharashtra | 180.1 | 186.7 | 3.66 | 174.0 | 180.4 | 3.68 | 176.0 | 182.5 | 3.69 |
| 14 | Odisha | 177.4 | 190.5 | 7.38 | 171.8 | 182.6 | 6.29 | 175.8 | 188.3 | 7.11 |
| 15 | Punjab | 174.9 | 182.0 | 4.06 | 167.1 | 173.7 | 3.95 | 171.4 | 178.3 | 4.03 |
| 16 | Rajasthan | 176.1 | 185.3 | 5.22 | 174.3 | 184.0 | 5.57 | 175.5 | 184.8 | 5.30 |
| 17 | Tamil Nadu | 184.2 | 194.7 | 5.70 | 184.7 | 192.8 | 4.39 | 184.5 | 193.6 | 4.93 |
| 18 | Telangana | 191.5 | 203.2 | 6.11 | 185.9 | 195.7 | 5.27 | 188.4 | 199.1 | 5.68 |
| 19 | Uttar Pradesh | 176.5 | 187.5 | 6.23 | 178.2 | 185.8 | 4.26 | 177.1 | 186.9 | 5.53 |
| 20 | Uttarakhand | 175.9 | 182.5 | 3.75 | 179.2 | 185.1 | 3.29 | 177.1 | 183.5 | 3.61 |
| 21 | West Bengal | 183.2 | 190.6 | 4.04 | 183.5 | 188.6 | 2.78 | 183.3 | 189.7 | 3.49 |
| 22 | Jammu & Kashmir* | 187.9 | 197.0 | 4.84 | 187.9 | 192.7 | 2.55 | 187.9 | 195.5 | 4.04 |
| All India | 178.8 | 188.5 | 5.43 | 177.4 | 184.7 | 4.11 | 178.1 | 186.7 | 4.83 | |
Notes:
- Prov. : Provisional.
- * : Figures of this row pertain to the prices and weights of the combined Union Territories of Jammu & Kashmir and Ladakh (erstwhile State of Jammu & Kashmir).
- @ : States having population more than 50 lakhs as per Population Census 2011.
Leave a comment
Related News


FACT News TV
View AllBreaking News
View All
Vigilance Bureau nabs Patwari red handed accepting bribe of Rs...
February 27, 2026

DAY 38 OF GANGSTRAN TE VAAR: PUNJAB POLICE CONDUCTS 515...
February 27, 2026

Biggest Victory of Truth and Honesty; Court’s Verdict a Slap...
February 27, 2026

Australia Women Crush India in 2nd ODI: Georgia Wolle’s Stormy...
February 27, 2026

Cure Grade 2 Fatty Liver Without Medicine: Doctor Shares 2...
February 27, 2026
Advertisement

Editor’s Desk
View All

What led to the NDA victory in Bihar polls?
November 14, 2025
Punjab needs a comprehensive land-use policy
May 29, 2025